Straits Times Index
Hang Seng Index
Nikkei 225 Index
 
Click here to login to the chat room during market hours.
 
 
Showing posts with label US. Show all posts

Monday, January 9, 2012

S&P 500 08/01/2012

S&P 500 possible mid term direction.

Will update in the future if it follows this pattern. Only price targets, time targets are not included in the chart.


PS: Just my personal view which could be wrong too. Not an inducement to buy or sell.

Tuesday, October 25, 2011

Wednesday, September 7, 2011

Tuesday, September 6, 2011

Tuesday, August 9, 2011

Who says market doesn't fall in a straight line?

On their faces!!

S&P 500 fell from 1340 to 1077 in a perfect straight line after the H&S breakdown and still falling!


Tuesday, February 8, 2011

S&P 500 - 08/02/2011

S&P 500.

This pattern gives a TP below 1290. It closed at 1319 on monday 07/02/2011. Let us see.


PS:Not an inducement to buy or sell.

Tuesday, July 20, 2010

S&P 500 - 20/07/2010 - update

This is the S&P 500 daily chart. After the death cross, the market rallied strongly towards the 50ma and pulled back. This 50ma and 200ma will continue to act as resistance. S&P and DJ has turned bearish creating lower lows and lower highs.


Saturday, July 17, 2010

Monday, July 12, 2010

S&P 500 - 12/07/2010 - update

S&P 500 intraday update.

S&P 500 triggers shorts if break 1073.
TP 1067-1062.

Thursday, July 1, 2010

Tuesday, June 29, 2010

S&P 500 - 29/06/2010 - update

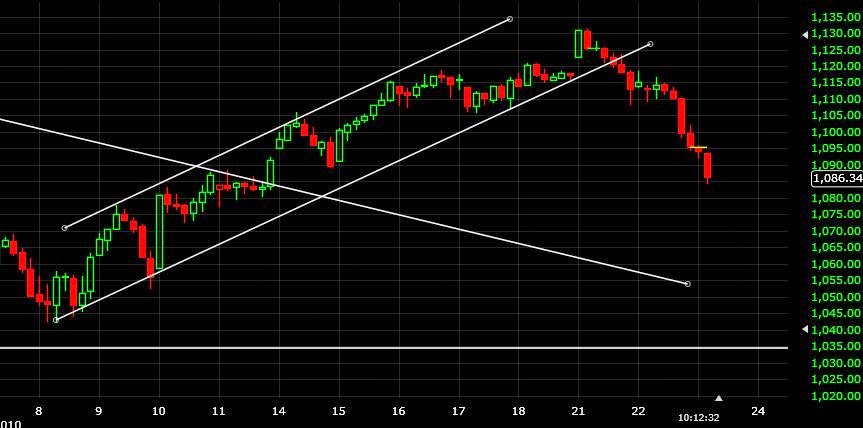
Still in the channel. But note the triangle forming. Watch for the breakout on either side.

Thursday, June 24, 2010

S&P 500 - 24/06/2010

SPX updated chart.

S&P trading in downtrend channel. Tonight, it needs to hold 1071. A break below might see 1066-1061.