Straits Times Index
Hang Seng Index
Nikkei 225 Index
 
Click here to login to the chat room during market hours.


Sunday, July 31, 2011

STI weekly update 01/08/2011

Last weeks posting for STI is here.

As mentioned last week, STI weekly has turned positive and it closed the week positive again.  Next resistance is at 3208, 3281 and 3314.  These are the previous highs.


STI Daily Chart: Previously we saw a breakout of the triangle on STI and so far the price has remained above the triangle after the island reversal pattern was spotted.  From the Symmetrical Triangle chart Pattern we deduce the Target price above 3450.  However, the pattern to be successful we should see a very strong breakout.  So far, the breakout has not seen any conviction in buying, this could partly be due to the weaker sentiments in US bourses and overall global economic conditions.  

A lot of times after a breakout on a chart pattern happens there is a throwback in the price back towards the breakout price.  But before that happens the breakout takes the price generally 5% above the breakout price first.  For instance, the breakout was at 3146.  5% of it comes to about 3300 which seems way far ahead still.  Added to the fact is that in the short term the market has turned overbought.  Also on friday we saw a Doji on STI daily chart which might indicate indecision.


Elliot wave on STI Hourly:

Last week I posted the Elliot wave count that I think is ongoing.  So far it has turned out as expected.  We might be in minor wave 4 (could be a double zig zag) of a major wave 3 currently as depicted below.  If the count is correct, ideally we should see a wave 5 up next.  100% fibo projection of wave 1 gives target of 3221.  123% fibo projection of wave 1 gives 3260 and 138% fibo projection gives 3280.  However, in the short term the market looks overbought.  I do not know how this count will turn out.  We shall see how it goes over the week.  Especially in the light of the big economic news from the US.

If this count turns out true then after completion of wave 3 we might see a nice wave 4 pullback followed by a wave 5 up towards the eventual target.  I will try to update this chart and count regularly on this blog.

Please do comment on your thoughts.  Good luck with your trading.


PS:  Just my personal view.  I could be wrong too.

Friday, July 29, 2011

STI 29/07/2011

STI hit yesterdays tagets.

STI now @ 3175.

Critical support is at 3167.  A break of which might see 3151-3141.

Breakout only above 3212.

Bullseye.

Thursday, July 28, 2011

STI 28/07/2011 - update

STI trying to breakout of 3177..

If breakout successful tp gives 3193-3203.

Bullseye.

STI 28/07/2011

STI @ 3168.

Support still around 3164 today.  A break below might see 3148-3138.

Breakout above 3177.

Bullseye.

Wednesday, July 27, 2011

STI 27/07/2011

STI @ 3175

Support remains at 3163.

Break out is above 3184. If breakout target range is 3200-3210.

Bullseye.

Tuesday, July 26, 2011

STI 26/07/2011 - update

STI broke above 3183..

Might be headed for 3199-3209.

Bullseye.

STI 26/07/2011

STI @ 3171.

STI almost hit yesterdays target zone with day high so far at 3178.21.

Support critical at 3161.

Breakout is above 3183.

Bullseye.

Monday, July 25, 2011

STI 25/07/2011

STI @ 3152.

Support at 3149.

Breakout is above 3163. If breakout tp is 3179-3189.

Bullseye.

Saturday, July 23, 2011

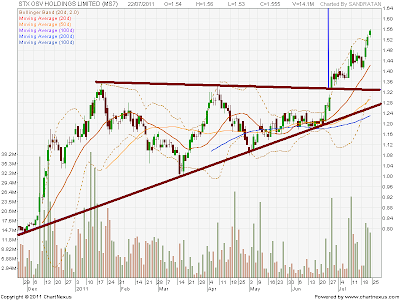
STX OSV 23/07/2011

STX. Previous post is here.
The price is up 20c since the last time I posted this chart. Thats the difference between an uptrend and downtrend chart. Pattern target is 1.9 in the long term.


Posted below chart 1 month back.


PS: Just my personal view. I might be wrong.

Ezra 23/07/2011

Ezra. Previous post for Ezra is here. Charts don't lie. On daily chart it might be creating a bear flag.


Posted below chart 1 month back.

STI weekly update 25/07/2011

I must admit I have not been posting too many charts recently. I will try to at least post STI chart weekly.

Weekly chart has turned positive. There was a breakout off the symmetrical triangle last week. A break of 3208 creates a higher high and confirms uptrend.


Daily chart: We also had the island reversal pattern last week. STI gapped up above the triangle and closed near day high indicates a strong uptrend. However, we must take note that if it closes inside the triangle again it might try to close the gaps at 3147 and 3100. Nevertheless, I think the trend has turned up strongly.


STI Hourly: For Elliot wave fans. Depicted below, I think we are in the intermediate up wave 3 of major wave 3. I think wave 4 might only begin after next week.


Good luck with your trading. Feel free to comment.

PS: Just my personal view. I could be wrong.

Friday, July 22, 2011

STI 22/07/2011

STI @ 3167.

STI hit and exceeded yesterdays targets.

A break of 3172 might give more upside towards 3188-3198.

Critical support at 3153.

Bullseye.

Thursday, July 21, 2011

STI 21/07/2011

STI @ 3121

It might be headed for yesterdays target.

Support at 3106. Break of 3130 might see more upside towards 3145-3155.

Bullseye.

Wednesday, July 20, 2011

STI 20/07/2011

STI @ 3118

STI if break 3120 might see 3135-3145.

Support at 3102.

Bullseye.

Tuesday, July 19, 2011

STI 19/07/2011

STI @ 3082.

STI has had no strength on the upside last few days. Every breakout has turned
more sellers to come in stronger.

Critical support today is at 3077. Break of which might see 3062-3052.

Breakout is only above 3090.

Bullseye.

Monday, July 18, 2011

STI 18/07/2011

STI @ 3088

STI made a low at 3065 and bounced aboved 3087.

It might be headed for 3102-3112.

Critical support at 3167.

Bullseye.

Friday, July 15, 2011

STI 15/07/2011

STI @ 3090.

Support remains at 3077. A break of which my see 3062-3052.

Breakout only above 3100.

Bullseye.

Thursday, July 14, 2011

STI 14/07/2011

STI @ 3095.

Today support at 3077. A break might see 3061-3051.

STI must break 3111 for more upside.

Bullseye.

Wednesday, July 13, 2011

STI 13/07/2011 - update

STI @ 3092.

STI broke 3091.. Might be headed for 3106-3116 to fill the gap.

Bullseye.

STI 13/07/2011

STI @ 3085.

Support at 3065.

Breakout only above 3091.

Bullseye.

Tuesday, July 12, 2011

STI 12/07/2011 - update

STI broke 3076 and hit the 3061-3051 target.

New day tomorrow. Good luck. :D

Bullseye.

STI 12/07/2011

STI broke down yesterday and hit targets.

Now @ 3087.

Critical support at 3076.

Breakout only above 3109.

Bullseye.

Monday, July 11, 2011

STI 11/07/2011

STI @ 3128

Support at 3122. A break of it might see 3106-3096.

Breakout is above 3136.

Bullseye.

Friday, July 8, 2011

STI 08/07/2011

STI @ 3146

Today support at 3127.

Breakout only above 3157.

Bullseye.

Thursday, July 7, 2011

STI 07/07/2011

STI @ 3130.

STI broke 3117 yesterday. STI kept breaking the supports this week so far.

Support at 3114.

Breakout is only above 3135.

Bullseye.

Wednesday, July 6, 2011

STI 06/07/2011

STI @ 3131

STI broke support at 3126 yesterday..

A break of 3117 might see 3101-3091..

Breakout is only above 3139..

Bullseye.

Monday, July 4, 2011

STI 04/07/2011

STI @ 3162

STI has stiff resistance at 3169.. If break above is considered breakout of
triangle formation.

Support at 3139.

Bullseye.

Friday, July 1, 2011

STI 01/07/2011

STI @3134.

STI hit all targets after breaking out of 3078.

Break above 3144 might take further to 3159-3169.

Support at 3115 is critical.

Bullseye.