


| Straits Times Index |
Hang Seng Index |
Nikkei 225 Index |
| Click here to login to the chat room during market hours. | ||
|
| ||
| Follow @NeatTrade | ||
Friday, September 30, 2011
CItydev 30/09/2011
Citydev.
I had posted the chart here on 16/09/2011.
Today it hit the lower trend line and bounced. It will be interesting to see whether the support trend line holds and whether it breaks out of the falling wedge.

I had posted the chart here on 16/09/2011.
Today it hit the lower trend line and bounced. It will be interesting to see whether the support trend line holds and whether it breaks out of the falling wedge.

STI 30/09/2011
STI hit yesterdays targets.
STI @ 2686.
Intraday support at 2679 and 2669. A break of 2669 might head towards 2656-2646.
Bullseye.
Thursday, September 29, 2011
STI 29/09/2011 - update
STI broke 2697.. Now at 2700.. Maximum I see around 2710-2720 today nothing more..
STI 29/09/2011
STI @ 2687
Intraday support at 2663.
Breakout is above 2697.
More updates on breakout or breakdown..
Bullseye.
Wednesday, September 28, 2011

STI 28/09/2011
STI hit yesterdays target zone on the dot at 2731.
STI @ 2717.
Intraday support at 2690.
Target zone still 2731-2741.
Break above 2741 might see 2755-2765 (But unlikely today).
Bullseye.
Tuesday, September 27, 2011

STI 27/09/2011
STI hit yesterdays targets.
STI @ 2696.
Intraday support at 2665.
Breakout is above 2717. If breakout it might head for 2731-2741.
Bullseye.
Monday, September 26, 2011
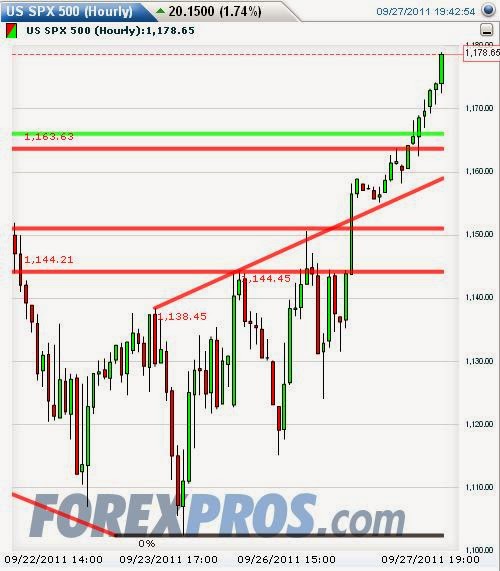
S&P 500 26/09/2011
S&P Hourly. Higher highs and higher lows. Also inverted H&S pattern. But there is no breakout yet.


STI 26/09/2011
STI @ 2669.
Intraday support at 2644.
Breakout is only above 2723.
We very well may have seen the high and low of the market today within the first hour of trading.
Bullseye.
Friday, September 23, 2011
STI 23/09/2011
STI @ 2676..
STI hit yesterdays targets and exceeded.
Intraday support at 2646.
Break above 2691 might see 2705-2715.
Bullseye.
Thursday, September 22, 2011
STI 22/09/2011
STI @ 2752.
Watch the intraday support at 2741. If break, might see 2727-2717.
Breakout only above 2761.
Bullseye.
Wednesday, September 21, 2011
STI 21/09/2011
STI broke out of the symmetrical triangle and stayed above so far.It might attempt to fill the gap next.


STI 21/09/2011
STI broke out of 2785. Might be headed for 2799-2810.
Intraday support at 2750.
Bullseye.
Tuesday, September 20, 2011

STI 20/09/2011
STI @ 2762.
Yesterdays target zone is still open after missing by 4 points.
Intraday support at 2751. A break might see 2737-2727.
Breakout is only above 2776.
Bullseye.
Monday, September 19, 2011
Ezra 19/09/2011


STI 19/09/2011
STI is trying to break the support at 2762.
If broken successfully we might see 2748-2738.
Breakout is above 2780.
Bullseye.
Saturday, September 17, 2011

Friday, September 16, 2011
STI 16/09/2011
STI @ 2800
Intraday support at 2779. A break might see 2765-2755.
Breakout is above 2809.
Bullseye.
Thursday, September 15, 2011
STI 15/09/2011
STI hit yesterdays targets/
STI @ 2758.
Intraday support at 2743.
Breakout is above 2776.
Bullseye.
Sti Elliot wave update 14/09/2011
STI is in a sideways corrective wave. Just possibilities. We might be headed for 2900+..


Wednesday, September 14, 2011
STI 14/09/2011
STI @ 2749.
Support at 2739. A break might see 2726-2716.
Breakout is above 2769.
Bullseye.
Tuesday, September 13, 2011
STI 13/09/2011
STI hit yesterdays targets.
STI @ 2769.
Breakout is above 2783. If breakout might take it to 2797-2807.
Intraday Support at 2755.
Bullseye.
Monday, September 12, 2011
STI 12/09/2011 - revised.
Revides estimates.
A break of 2758 might see 2744-2734.
Breakout only above 2770.
Bullseye.
Friday, September 9, 2011
Sti Elliot wave update 08/09/2011
Elliott waves on STI. Primary and alternate count. Just possibilities.


Thursday, September 8, 2011

STI 08/09/2011
STI @ 2822.
STI hit yesterdays target.
Intraday support at 2803.
Breakout is above 2873.
Bullseye.
Alternate view.. Many charts 07/09/2011
As per Elliott wave count, STI is in wave 2 if major wave 3 down. However, here is an alternate view.
Many index stocks and STI is showing an inverted Head & Shoulders pattern. There is no breakout yet. There has to be a high volume breakout above the neck line to confirm this view.
Gold double top also supports this view. But nothing is firmed until we see high volume breakouts.
Bullseye.
STI

Kepcorp

Sakari Resources

Yanlord

Capitaland

NOL

SembMar

Wilmar

Noble

PS: Caveat Emptor. I could be wrong. These are my personal views and not an inducement to buy or sell.
Wednesday, September 7, 2011


STI 07/09/2011
STI @ 2801.
Intraday support at 2788.
Breakout is above 2815. If breakout might see 2829-2839.
Bullseye.

Tuesday, September 6, 2011

Monday, September 5, 2011
STI 05/09/2011
STI @ 2770
Support today is at 2761. A break of it might see 2748-2738.
Breakout is only above 2801.
Bullseye.
Saturday, September 3, 2011

Friday, September 2, 2011
STI update 02/09/2011
Updated count for very short term. It is a bear market rally so be cautious with your trades.
We seem to be in wave 4 of the short term count. Wave 5 might/should unfold. It could either be truncated to hit recent high or it might take out recent high.
All bets off if STI breaks 2780. This count becomes invalid then.

We seem to be in wave 4 of the short term count. Wave 5 might/should unfold. It could either be truncated to hit recent high or it might take out recent high.
All bets off if STI breaks 2780. This count becomes invalid then.

Thursday, September 1, 2011
STI 01/09/2011
STI @ 2885.
Support at 2874. A break might see 2860-2850.
Breakout is above 2913.
Bullseye.
Subscribe to:
Posts (Atom)
